Summary: Comparison of Four Treatments
The purpose of this project was to analyze the data to show how four treatments (Capomulin, Infubinol, Ketapril, and Placebo) compare. In this study, 250 mice were treated through a variety of drug regimes over the course of 45 days. Their physiological responses were then monitored over the course of that time.
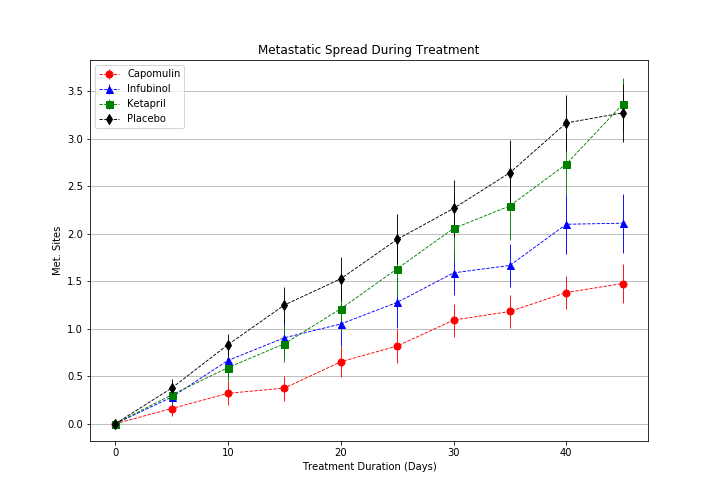
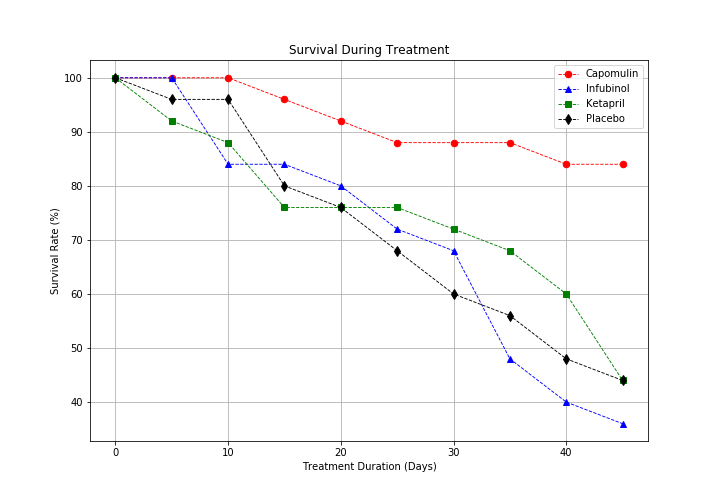
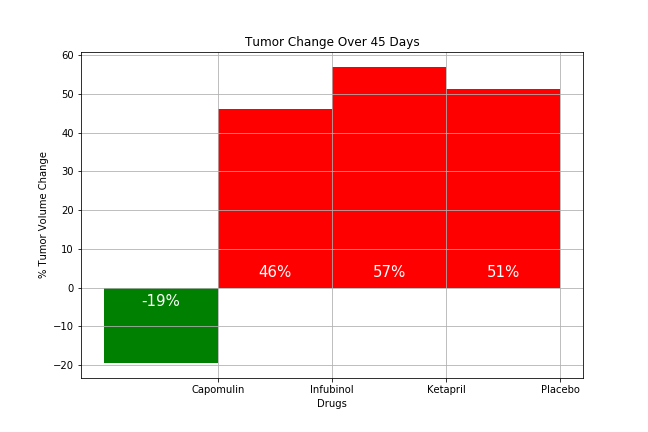
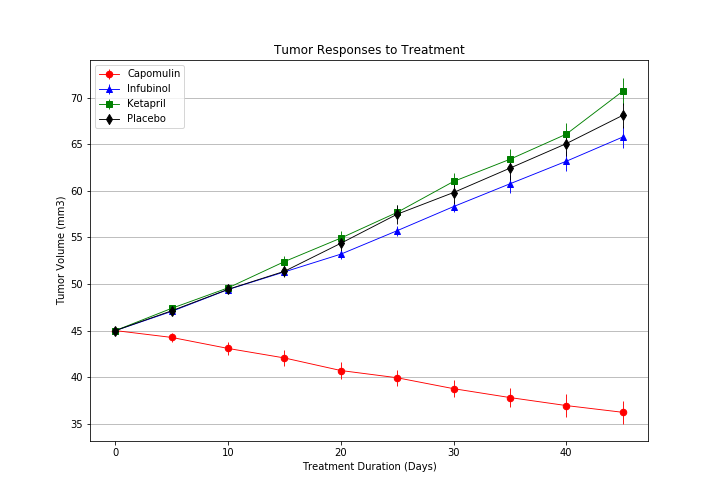
After assembling the dataset, I used Matplotlib to plot various aspects of the Mice responses to the four treatments. Factors I looked at included: tumor volume, number of metastatic sites, and survival rates. I then created a bar graph that compares the total % tumor volume change for each drug across the full 45 days. This site provides the source data and visualizations created as part of the analysis, as well as explanations and descriptions of any trends and correlations witnessed.